
This is the first of several posts covering the story of how I assemble and utilize data for stories and other creative projects. In this case, I’ll look at the spreadsheet where I store the data of prospective, in-progress, and on-submission stories and ideas. I’ll be telling the story of my data on stories.
Most of my professional content will be hosted on my GitHub portfolio but I thought my blog was as good a place as any to practice a bit of data storytelling.
Google uses a six-part framework for data analysis that utilizes the steps of Ask, Prepare, Process, Analyze, Share, and Act, so we’ll be using a modified version of that.
Let’s get started!
Ask
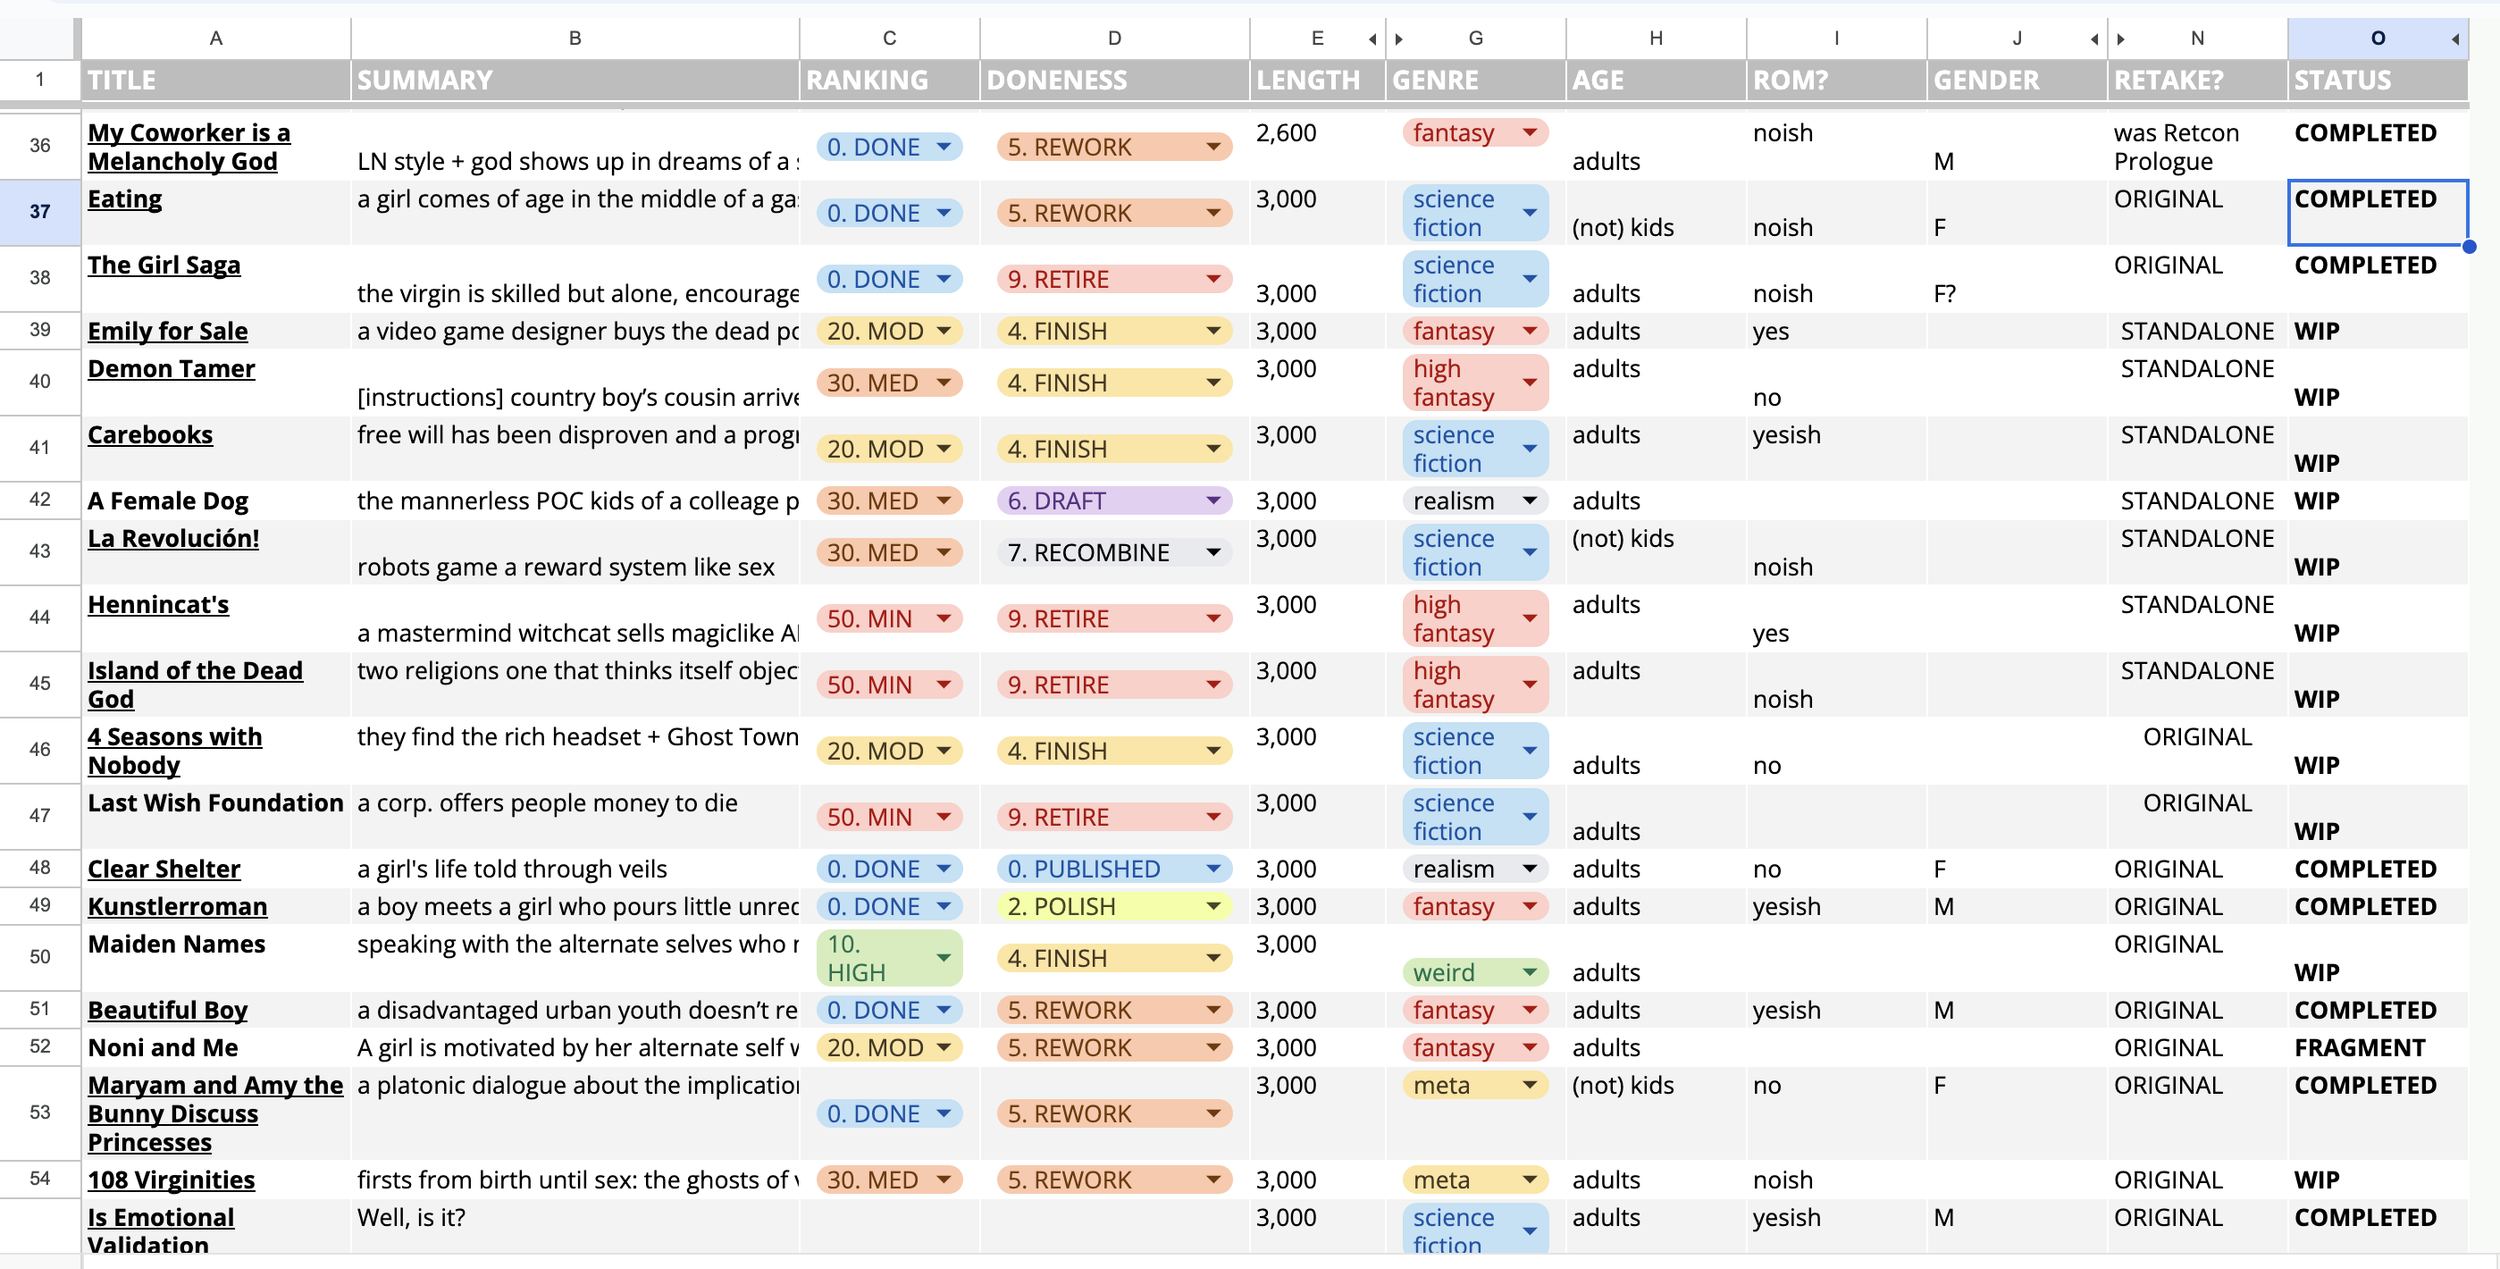
The starting spreadsheet has data spread across 4 tabs (and 2 irrelevant tabs), with quite a few inconsistencies, a lot of empty fields, and a bit of missing data. I’m not fixated enough to update it regularly, so it is outdated in a few places. It looks a bit like this:
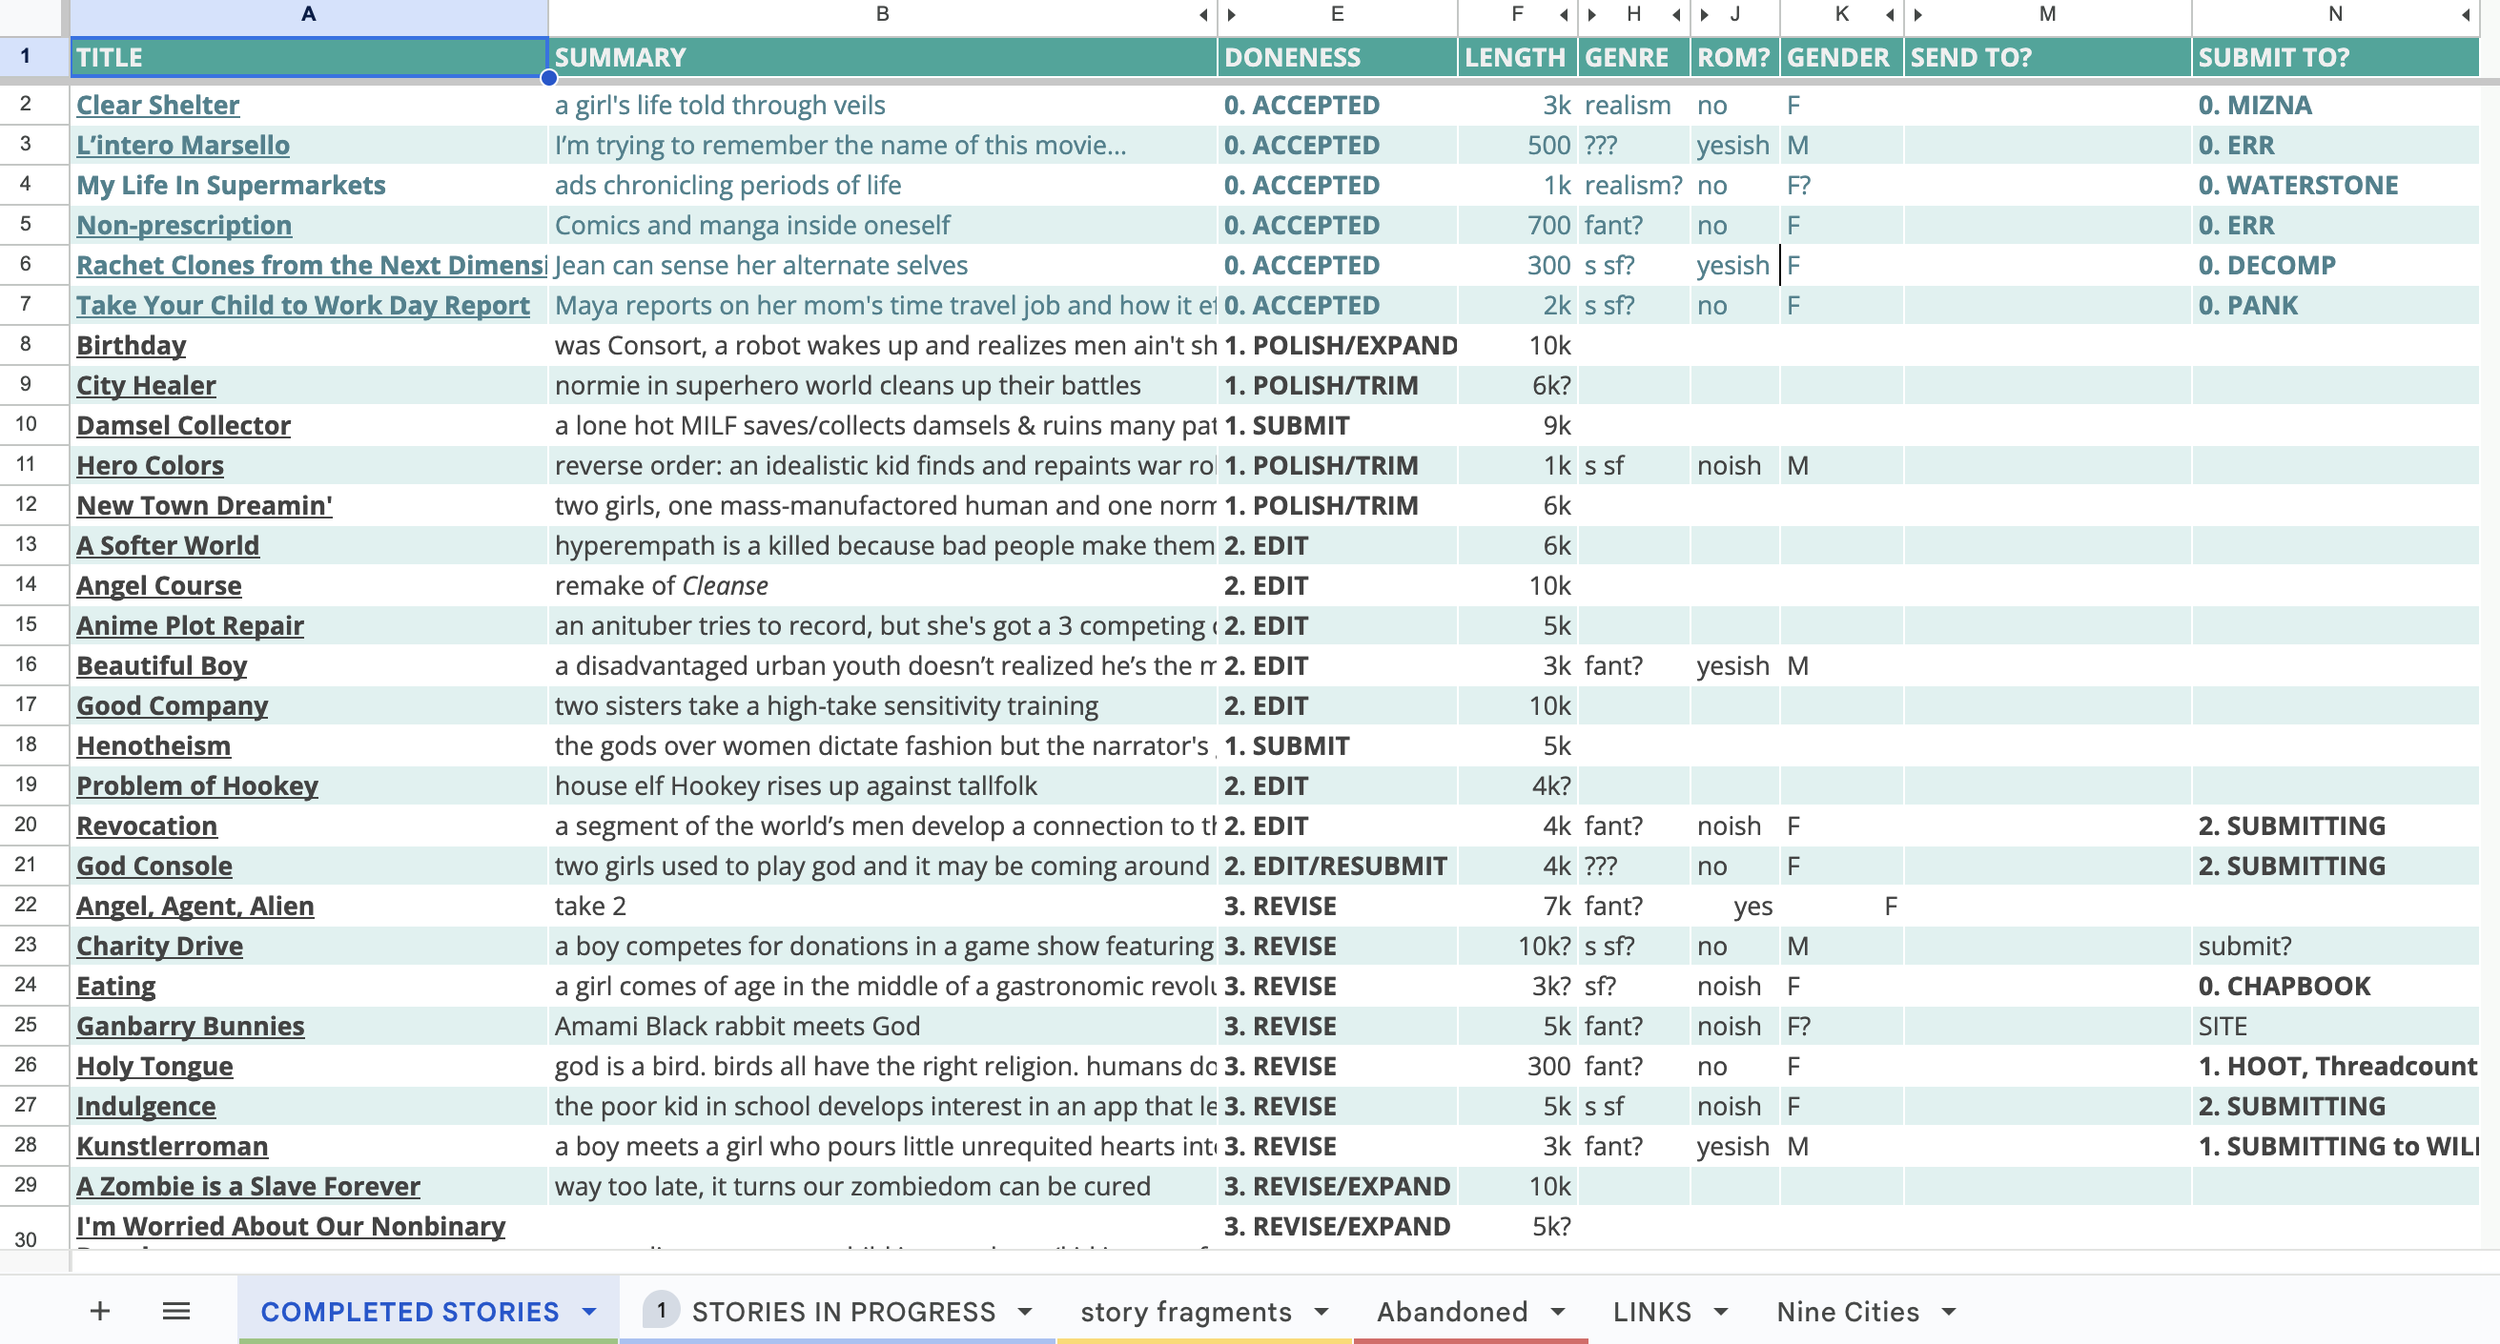
When I created this spreadsheet about ten years ago, my question was roughly What kind of stories do I tend to write?
That starting question is a little too broad for data analysis, but it did shape the data being collected: I wanted to make sure I wasn’t not defaulting to straight white male protagonists, so I collected data on the protagonist’s gender under GENDER.
I was worried I used romantic love as a central conflict¹ too often, so I tracked that under ROM.
I was also trying to get a handle on the usual lengths for my stories—they tend to run longer than projected—and look at the characteristics of accepted stories versus hard-to-sell ones.
Still, the data we’re tracking includes:
Story TITLE with an embedded link to the draft, if available
Story SUMMARY
[hidden] RANKING of how much I want to work on said story
DONENESS measure of how close the story is to finished
LENGTH or projected length
[hidden] whether it’s a STANDALONE idea or attached to a larger project
story GENRE
[hidden] AGE of protagonist or intended audience
Whether the central conflict centers around ROMance
GENDER of protagonist
[hidden] whether it has a SOUNDtrack to inspire it
which friends I could SEND TO for a critique trade,
which ideal or actual market to SUBMIT TO
[hidden] whether it’s my first try at a story or a RETAKE
I want to pick two elements that already have a lot of data to work with, RANKING and DONENESS. I think I would be fun to see how far I’ve gotten with each of these ideas and projects, and to compare that with my excitement over a project.
Prepare & Process
Because this is self-generated data, I have less collecting, processing, and transforming to do. For that reason, I combined the Prepare and Process steps into one. I’ll actually be doing a little of both here.
Before we start cleaning and creating consistency, I want to make a copy of the original and title that copy “Story Idea Masterlist for Analysis.” We remove the final two tabs but add an empty findings tab for graphs and Pivot tables.
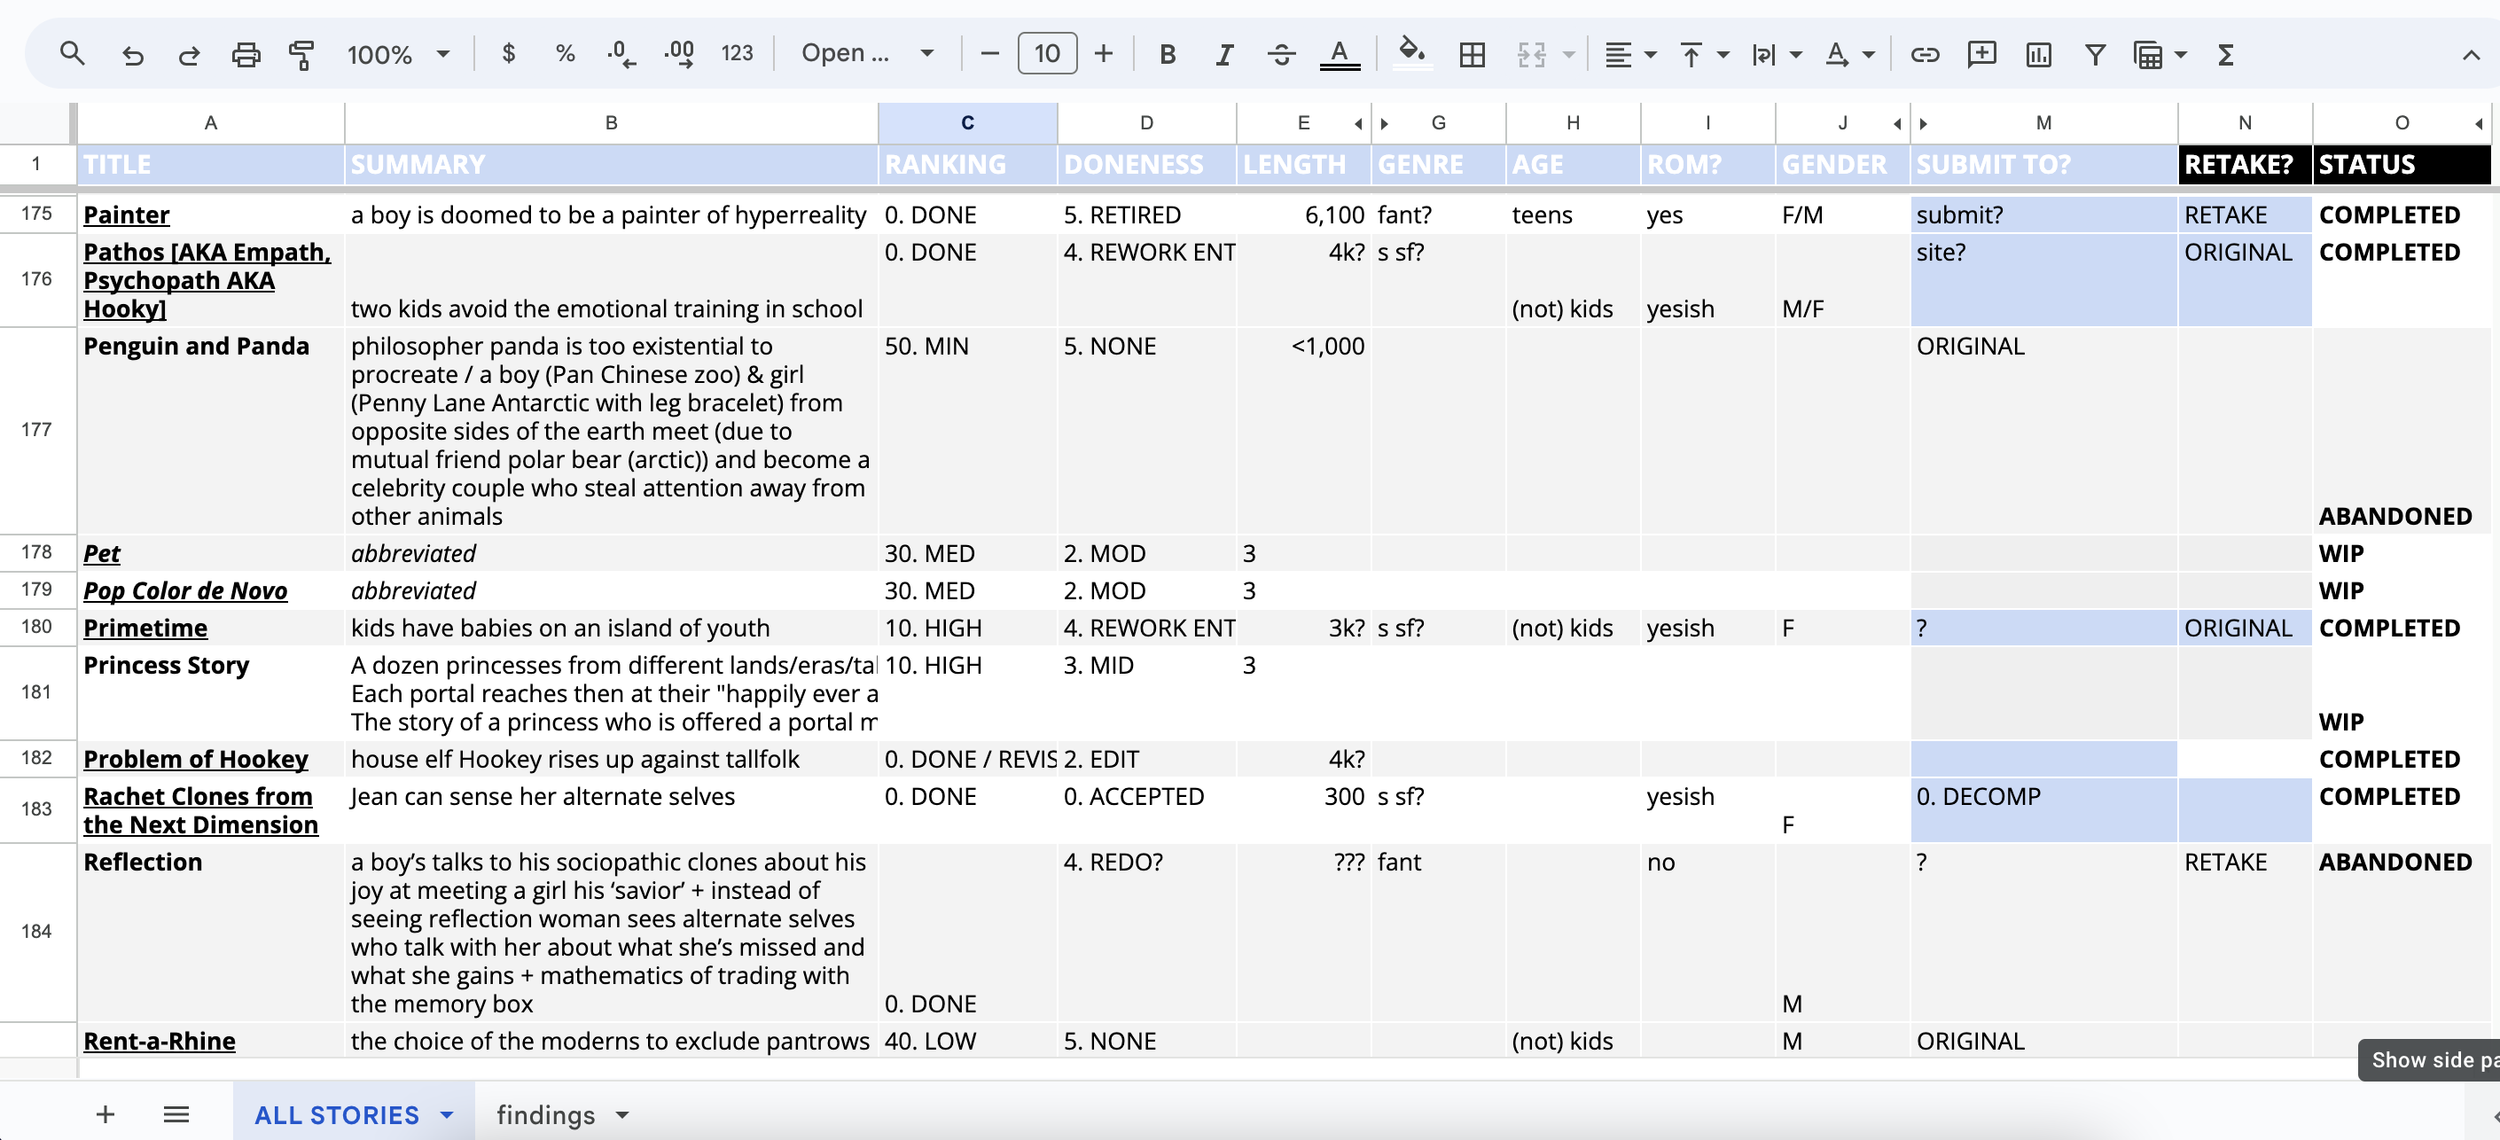
Because the data is spread across three tabs, we’ll create an extra STATUS column to each tab so I can classify stories as COMPLETE, WIP, FRAGMENT, or ABANDONED. I tag all stories in COMPLETED STORIES as COMPLETE, give all STORIES IN PROGRESS the status of WIP, and so on for FRAGMENT, and ABANDONED. And then we do a FULL OUTER JOIN—I’m just kidding, this data set is small enough to combine manually.
After we add all of the four tabs to one main sheet, we end up with this messy but comprehensive list of 240 entries:
Next, we’re going to do some aesthetic cleaning. I want a consistent font size and color, as well as alternating colors for legibility. I’ll remove notes to myself and even weird formatting like strikethroughs.
As I work, I realize more opportunities for improvement. For example [RECYCLING CENTER LOVE STORY] is now called “The Saint of the Central Murf” and it’s no longer a love story. I hand-drafted the entire plot when sitting in class, so it’s actually HIGH in terms of doneness, not LOW. I update as I go.
I also want to trim some data to focus in on the key aspects of RANKING and DONENESS. I don’t need to know if a story is STANDALONE or a RETAKE right now, and for the sake of this experiment, I am not interested in publication and have no friends². STANDALONE, RETAKE, SEND TO, and SUBMIT TO have all got to go. My options are to delete the columns, copy and paste them elsewhere, or hide or filter them out. I think I’ll go with the most reversible option of hiding them.
After all of that cleaning, we end up with something like this:
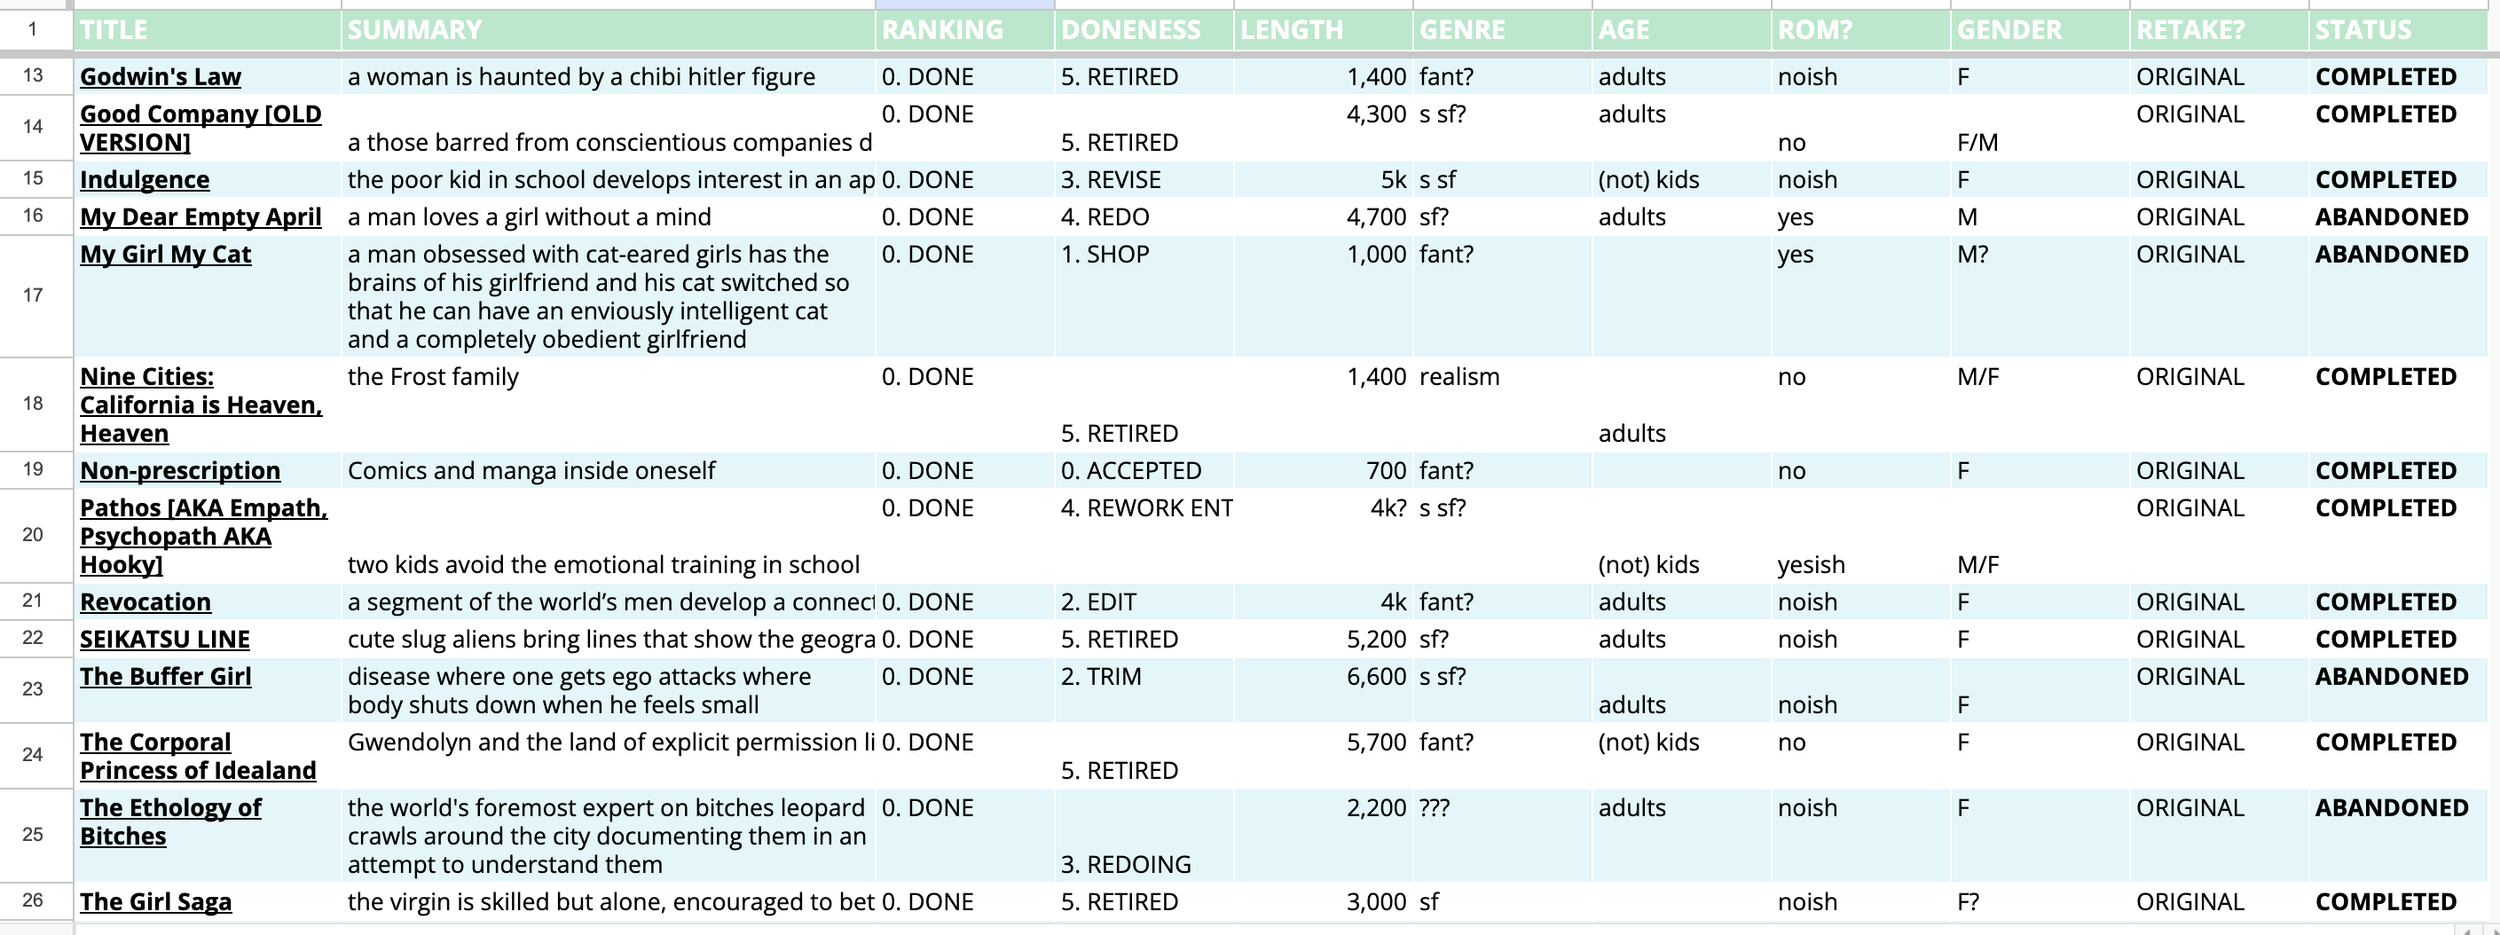
Doesn’t it look so much cleaner?
I think this is good enough to do some preliminary analysis to see what findings—or issues!—arise.
Analyze
Now I’m going to pop on over to the FINDINGS tab (since renamed ANALYSIS) to make a chart to show us the shape of the RANKING data. What’s the damage over here?

It turns out that the ranking system is all wonky!
Why are there two kinds of DONE? Why is REDO ranked the same as DONE? Why are there two kinds of Moderate and Medium? Why is FRAGMENT unnumbered? What is going on with NONE? Did data from the DONENESS column bleed into this one?
It’s time to bring some consistency to this system.
I’ll keep the 0-5 numbering so the columns will continue to go from most-done to least-done when alphabetized. DONE will remain a 0 category to signify that I’m not truly ranking its members—They’re already done, after all!
Everything else to fit within 5 categories: HIGH, MOD, MED, LOW, and MIN.
I like to have odd-numbered rating systems with MED, representing medium or median, at the midpoint. This will cover those ideas and stories I’m neutral about. Below that is LOW, which don’t appeal to me right now, and then MIN, which I have the minimal possible interest in—possible in part because the idea itself is incomplete. Above MED will be MOD, those moderately intriguing ideas that still have some juice but are on the backburner. The number one will go to those HIGH-rated stories I just can’t stop thinking about, even in the shower or on the bus.
When we tag everything according to this sleeker system, this is what we get:
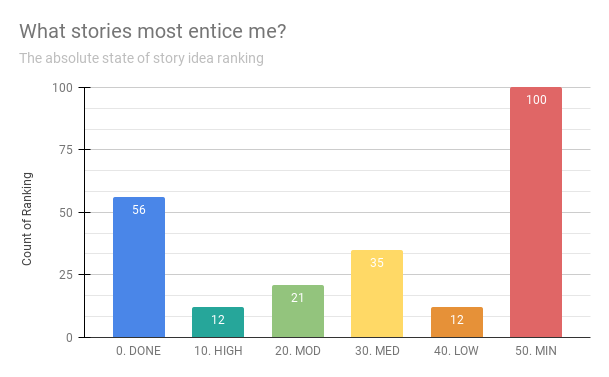
It looks like I’ve written roughly 50 complete stories over the last decade or so. I have twelve stories that are particularly exciting right now, so I should focus on revising those. It’ll be fun to see how that excitement maps to how complete the story is! After that, I have 20-something stories to work on when those are done, and 30-something stories I’m roughly neutral about.
My MED is not quite the median, and I think it’s because so many entries labeled FRAGMENT have ended up in the MIN category. Right now, it looks like I have 100 stories that just aren’t doing it for me but those stories are likely no more than premises, pitches, concepts, and whispers.
One example of a MIN-level interesting idea is “a spiked book that changes the world” and I can’t remember what I meant by that but I think it was about infohazards.
Another MIN-level fragment is “members of a longitudinal study“ which is more of a character detail. Same with “immortal/unkillable Black girl”—there’s something there, the slightest soupçon of a theme or metaphor, but there’s not enough to write about. If anything, I could feed this level of fragment into a Fowlerian Engine³ to generate actual stories.
Let’s create a pivot table charting how enticing the ideas according to RANKING are versus how close I am to DONE with them:
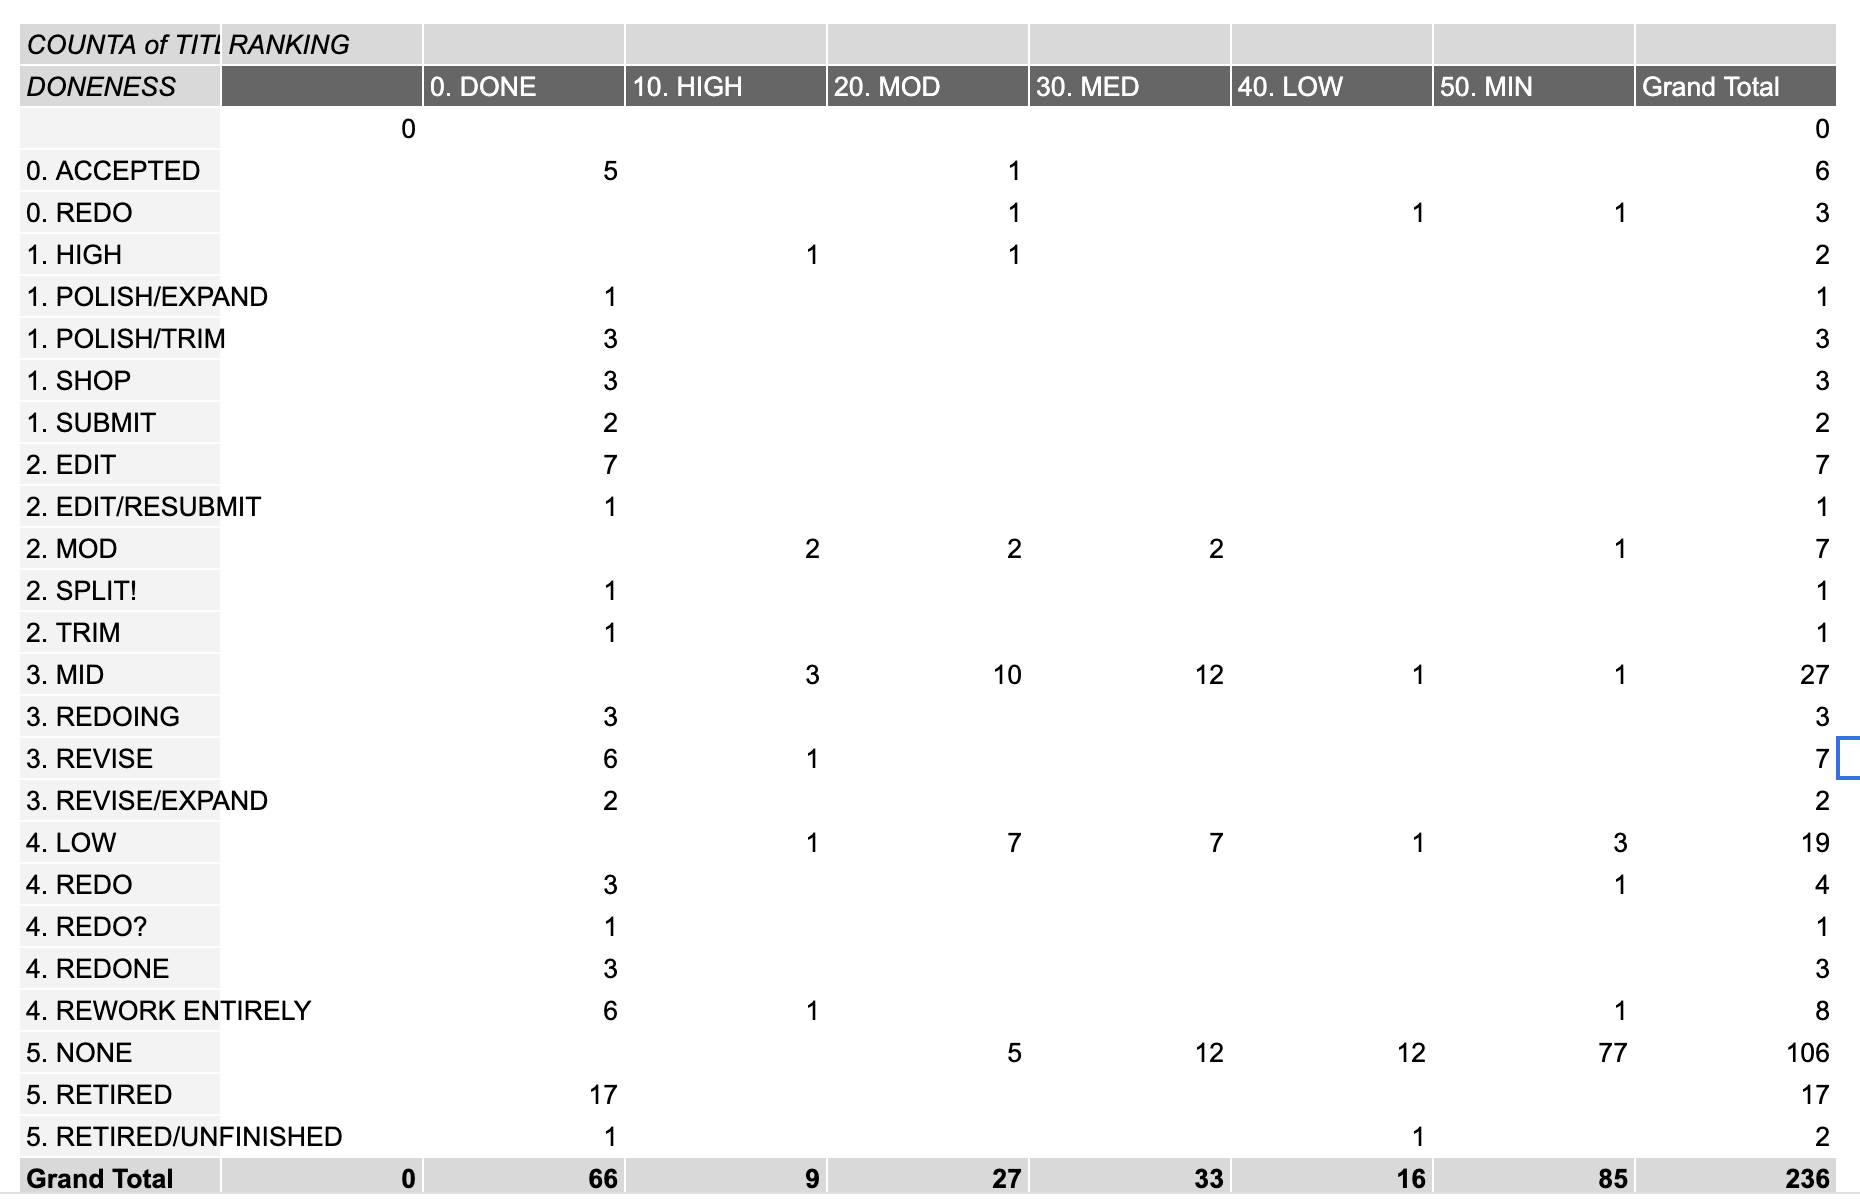
Again, we find there are too many categories and a lot more cleaning to do.
It looks like I’ve been using the DONENESS category to leave notes on next steps to myself: some of these stories I want to rework entirely, some I want to trim, some I want to expand, some I want to workshop, and just two are ready to submit.
To prevent this kind of messy tagging in the future, I’ve decided to use Google’s built-in data validation rules to include drop-down lists.
And since I’ve already been using the data to track the next steps, let’s lean into that as we standardize the information in the DONENESS category. I also want to make the wording more unlike the RANKING column.
We will have PUBLISHED as our 0 instead of DONE, while 1 will be for the end goal of SUBMIT.
The two POLISH variations into one and apply to completed stories in need of edits and minor revisions. EDIT, SPLIT, TRIM, and other large-scale changes will be grouped here, so long as they refer to complete stories. I’ll put the process of what to edit on the stories themselves.
SHOP will become WORKSHOP for clarity. These are the stories done enough to get another pair of eyes.
FINISH will take the place of moderately and highly complete stories. These are all the ones that are more than half-done that I need to get BIC to finish.
REWORK will hold REDO, REDOING, REWORK, and all the stories that need major revisions. These are technically complete but need such an overhaul that it’s like I’m starting from scratch.
DRAFT will hold all the less-than-half-done stories. These can be anything from an annotated Freytag's Pyramid to a Pixar Story Spine to a complete outline, anything where I don’t yet have a draft.
RECOMBINE will cover any story that has salvageable elements, whether it’s a fragment or a first attempt to say something. It overlaps with RETIRE in that I’m no longer interested in that version of the story.
RETIRE, lastly, will cover all those stories and concepts I’ve fully given up on.
Here’s a pie chart of how the new schema works out:
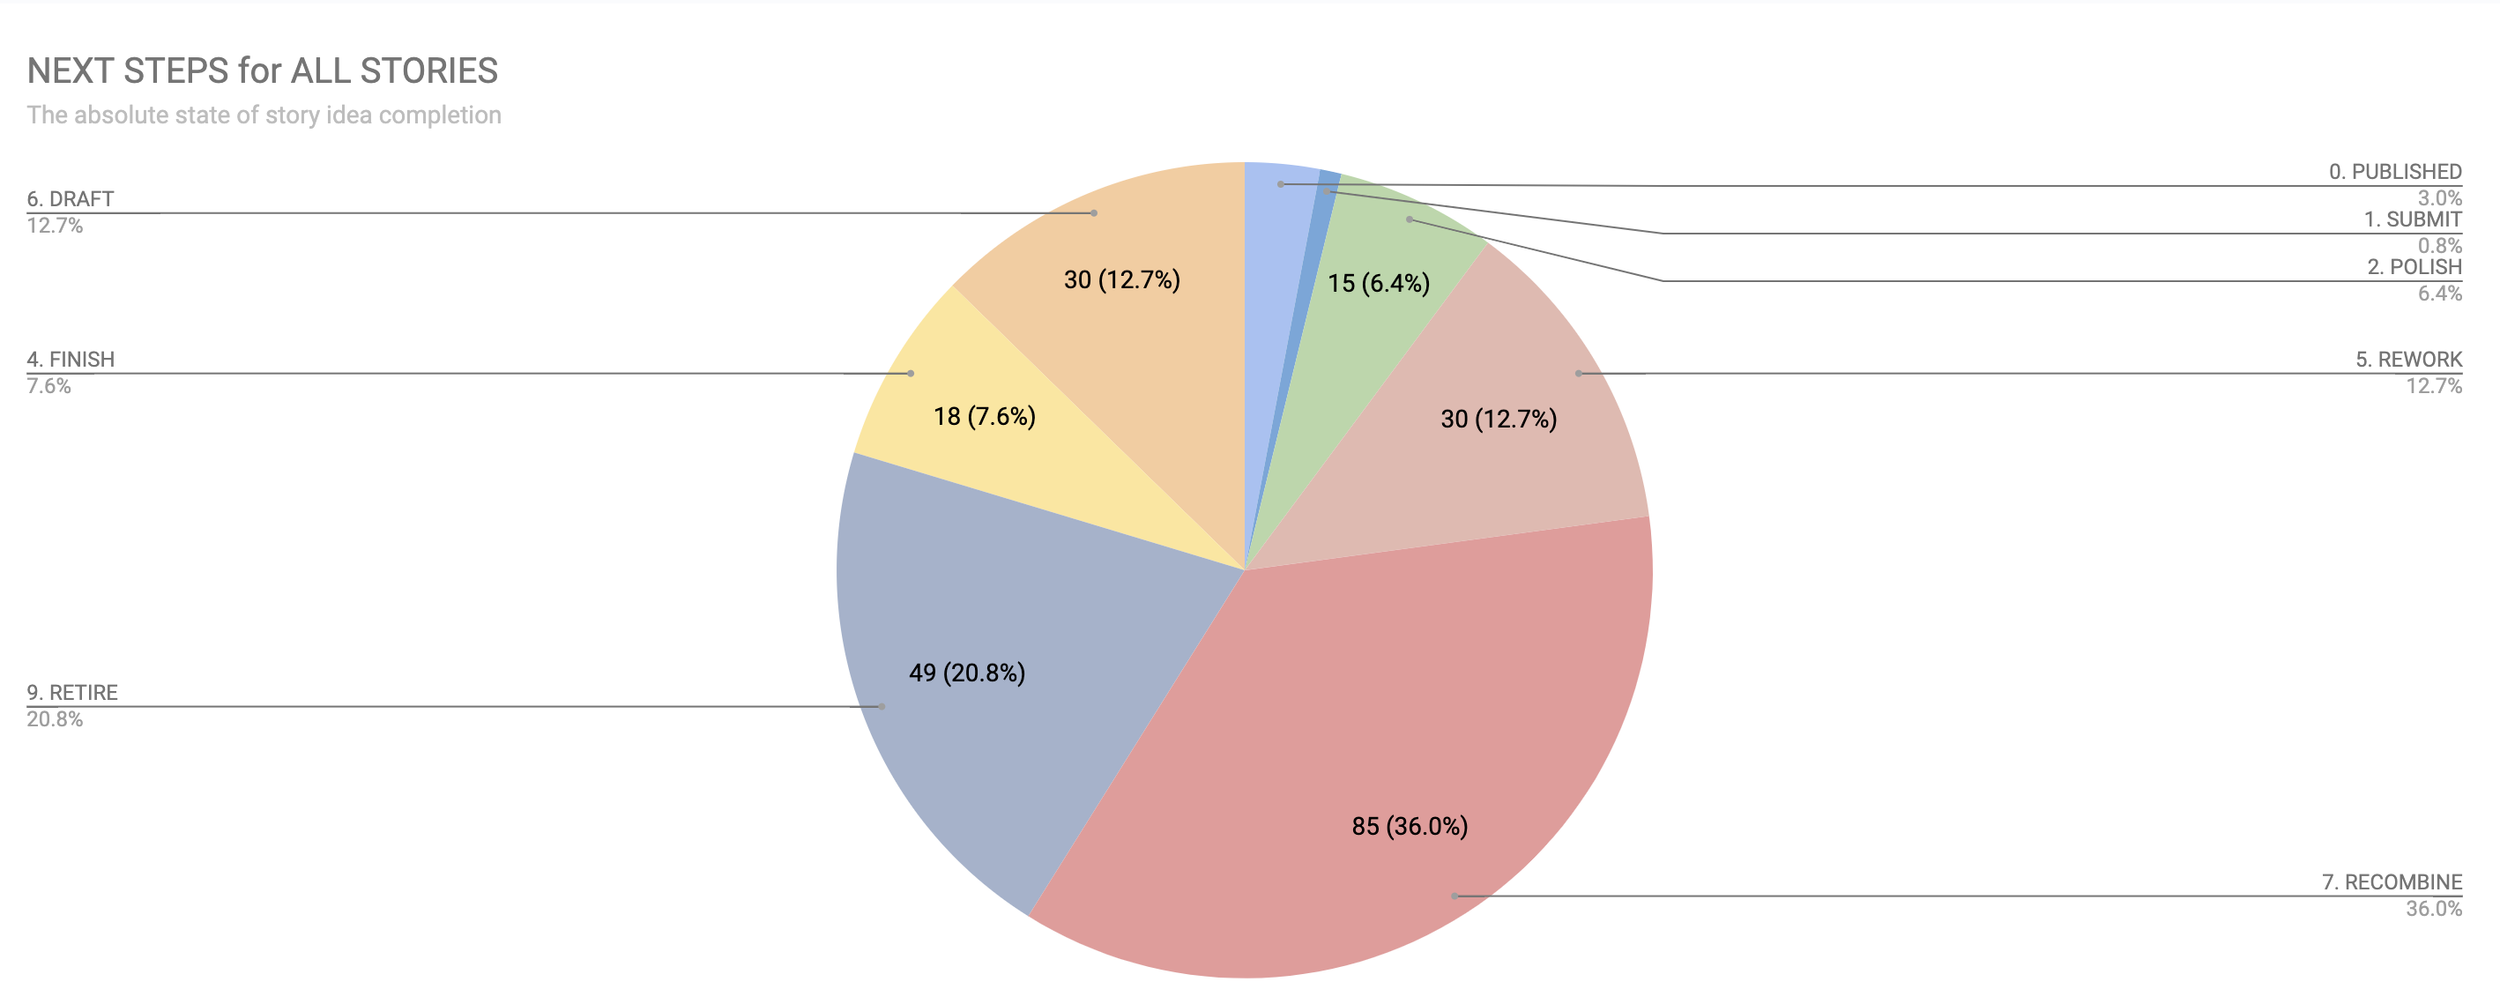
With this new schema, we are looking at what I want to do to a story rather than how complete it is.
A fifth of everything I have is going straight into the trash, looks like. More than a third will be scrapped for parts (or already only parts), and about an eighth of every story I have needs to be substantially reworked—these must be the bulk of my complete works.
There are only 15 near-done stories to polish, 18 to finish writing, and 30 worth drafting. The two stories I have deemed submittable are such a small number percentage that they can barely be seen!
We could dig deeper into this data by removing the DONE/PUBLISHED stories and the fragments and retired projects. But even just eyeballing it, it looks like I have a rough three-way split between stories that need revising, stories that need to be drafted, and stories that need finishing and polishing.
If we go back to our pivot table comparing DONENESS to RANKING, that gives us:

That a boring way to look at the data, so we’re going to turn that Pivot table into a stacked bar chart, and then we’ll be done!
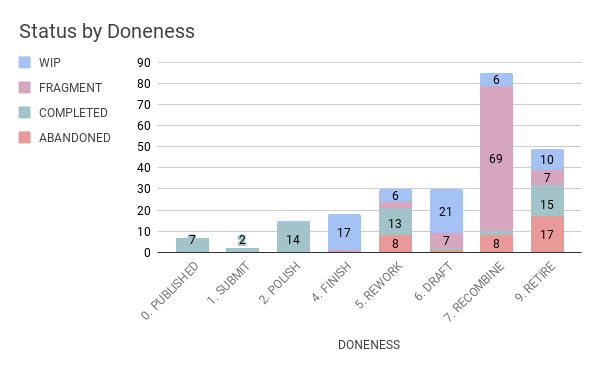
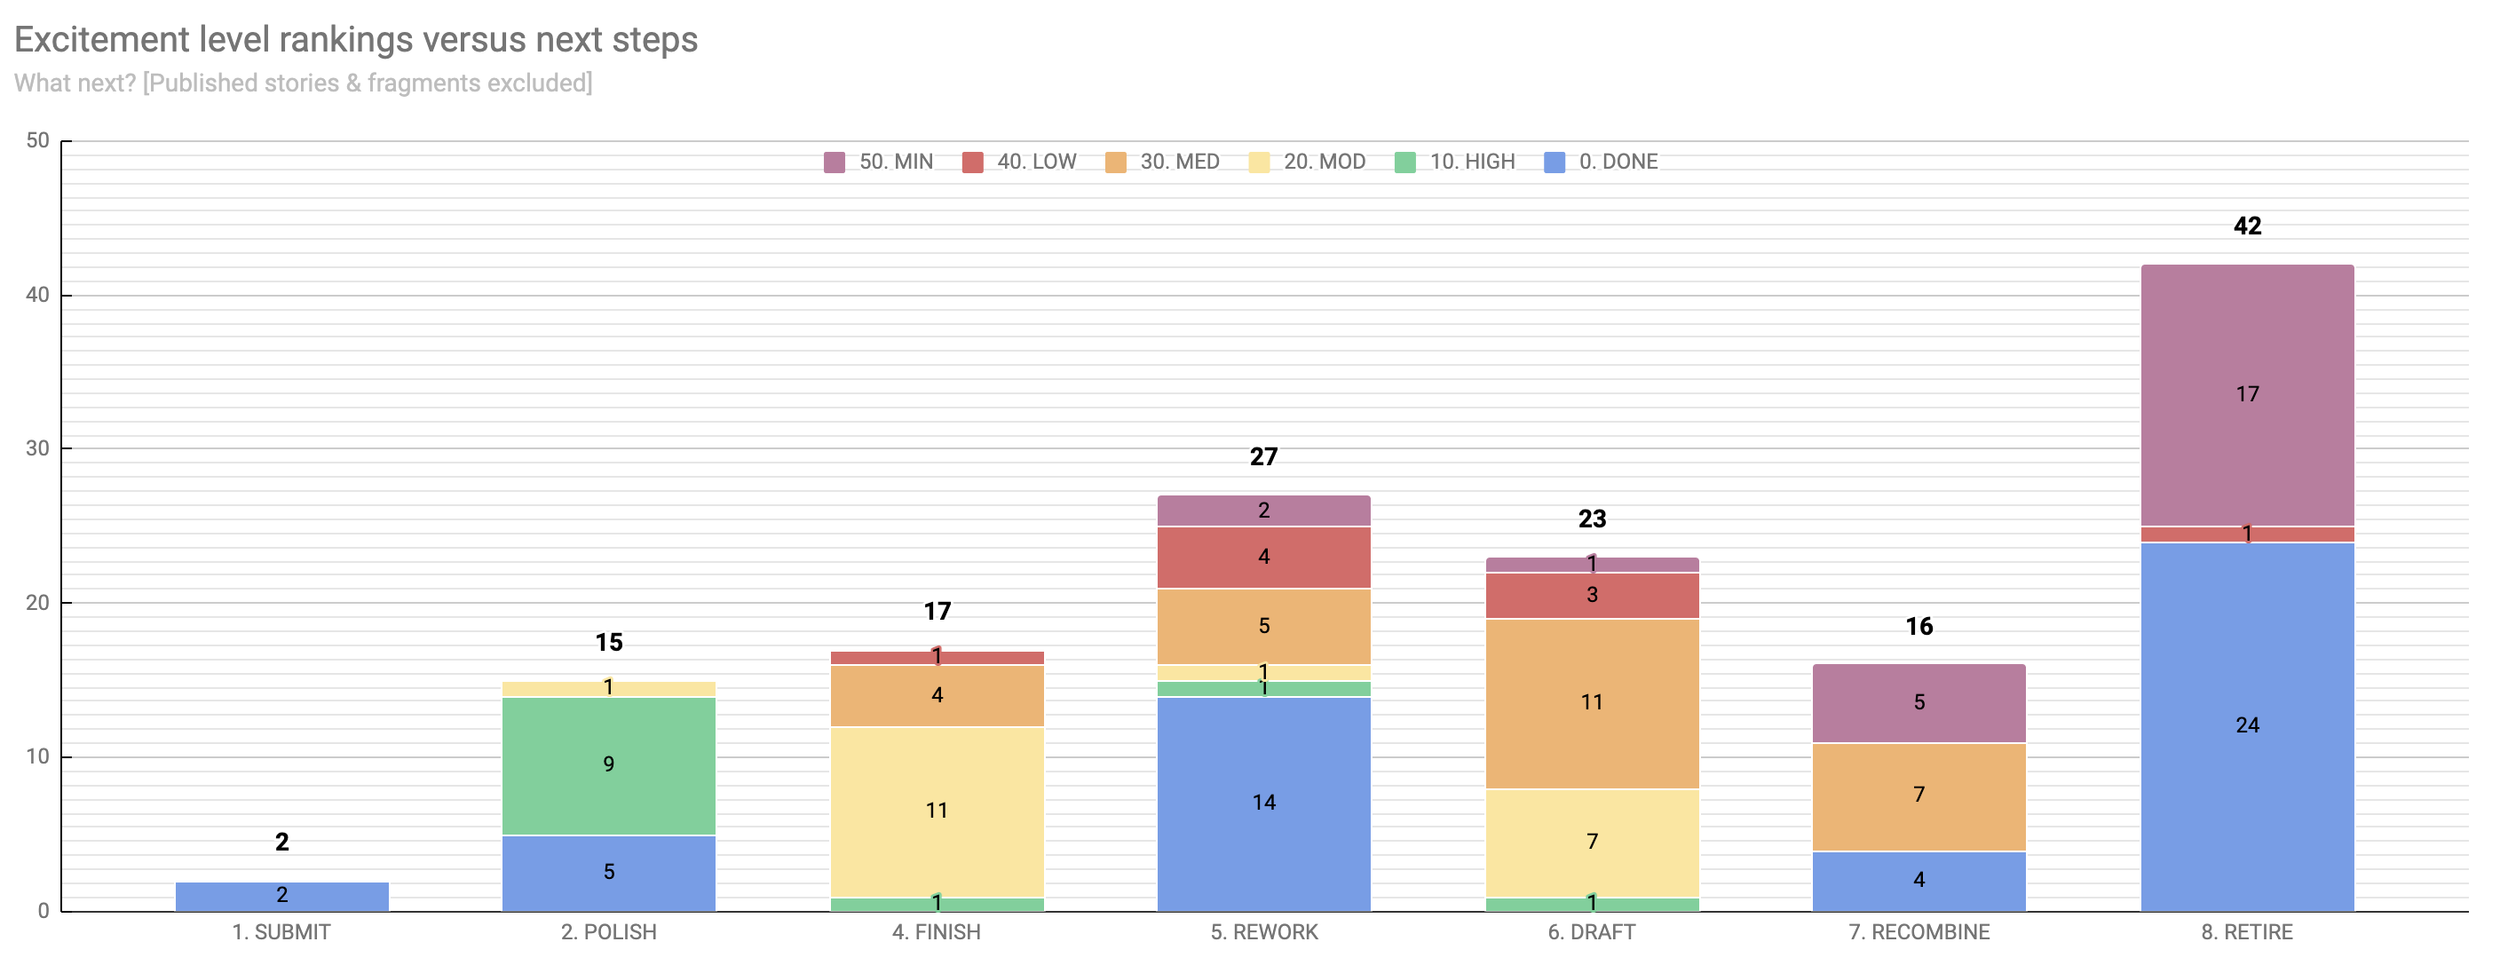
So here is it, the chart you’ve been waiting for:
How far have I gotten with my many ideas and projects, and how does completion levels compare with my excitement over a project?

A couple of interesting trends are clear: half of the ideas I want to retire are complete stories while another half are minimally-rated stories. 7/8ths of the stories I want to scrap for parts have a minimal rating. All of the published and submit-ready stories are complete, of course. (Although, I’m pretty sure this doesn’t cover all of my published stories.)
I’m highly excited by at least one draft, reworking, and revisions; but I’m most excited to polish nine particular stories. I also have at least one story of low interest in every category lower than POLISH. I’m no doubt procrastinating on those. The moderately high stories are taking a clear back seat to the highly-anticipated stories, as they should.
I sense some anomalies in the RECOMBINE and RETIRE categories, however. My curiosity brings me back to the question of how fragments are affecting the results here.
So let’s check that out real quick.
How does the comparison of Doneness to Fragment/Complete/Abandoned status look?
It looks like recombination is the next step for most fragments.
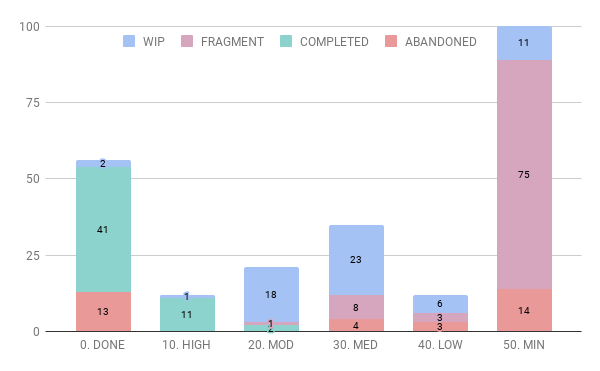
Well, how does the comparison of Ranking to Fragment/Complete/etc status look?
Yep, most fragments are minimally enticing!
For the sake of data clarity, I’ve removed the fragments and the published stories so I can get a better picture of the data trends. I’m excited to learn how I feel about my own writing (no, I joke).
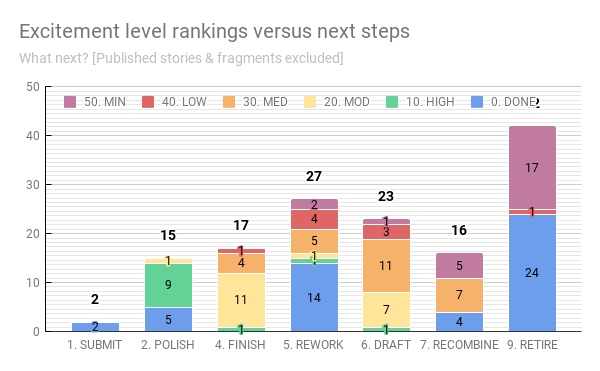
Here’s what we get if we refine the data to take out those outliers:
When we remove FRAGMENTs and PUBLISHED stories, it still turns out that half of what I abandon is complete stories—less than half are scraps. It might be interesting to look into the age of those abandoned stories, as they might just be silly juvenilia. Or, it might be interesting to compare it to the data on REWORKs and RETAKEs I’d begun to capture—how many of these abandoned were transformed into something else?
If the number one thing I do is scrap ideas, then number two is reworking. I have 27 pieces that are varying levels of exciting that all need to be approached from a different angle.
The third-most next step, drafting, means I have 23 stories that I’ve barely even started.
I’m also curious about the nine HIGH-ranked stories in the polishing stage—there’s a chance they could be moved to REWORK, RETIRE, or RECOMBINE once done. There is no guarantee that anything I write ever makes it to the submittable stage.
One takeaway from this is that I have lots of ideas but very high standards. I tend to take on the same idea from multiple angles in hopes that I can crystalize the idea into a story that excites the reader as much as the initial concept excited me.
Incidentally, the spreadsheet looks like this after all that cleaning.
She’s so pretty!
Share & Act
I’ve combined the final two steps of Google’s process because this blog is an example of both of them: I have shared this data with you, and maybe the story behind it will inspire you to think deeper about your own process and tendencies.
I’ve already been acting on the information in the spreadsheet over the years of using it: I shifted who I write about and how, I turn fragments into full stories or steal elements from abandoned ones, I challenge myself to write shorter or accept that I’ll end with a hard-to-place novelette,.
This took far longer than I expected, so my next actions will be to finally eat, pay attention to the rabbit affectionately licking my pillow for attention, rest my eyes by reading some paper books, and then to get overdue critiques back to a friend.
This has been Story Data Story 1, an analysis of my Short Story Masterlist. Maybe next time I’ll use Tableau or Python’s data visualization tools.
Stay tuned for more!
(The above is an embedded version of the final stacked chart. Let’s see if Squarespace can render it.)